No Signup Required • Instant Results • 100% Free Tools
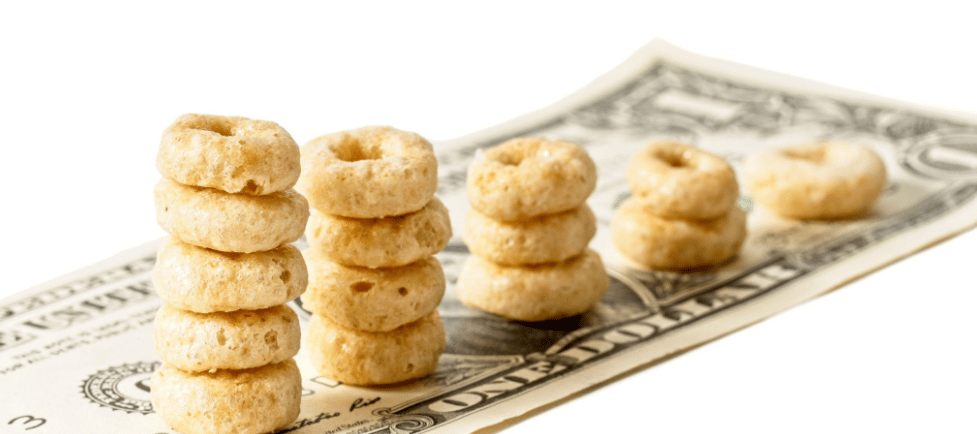
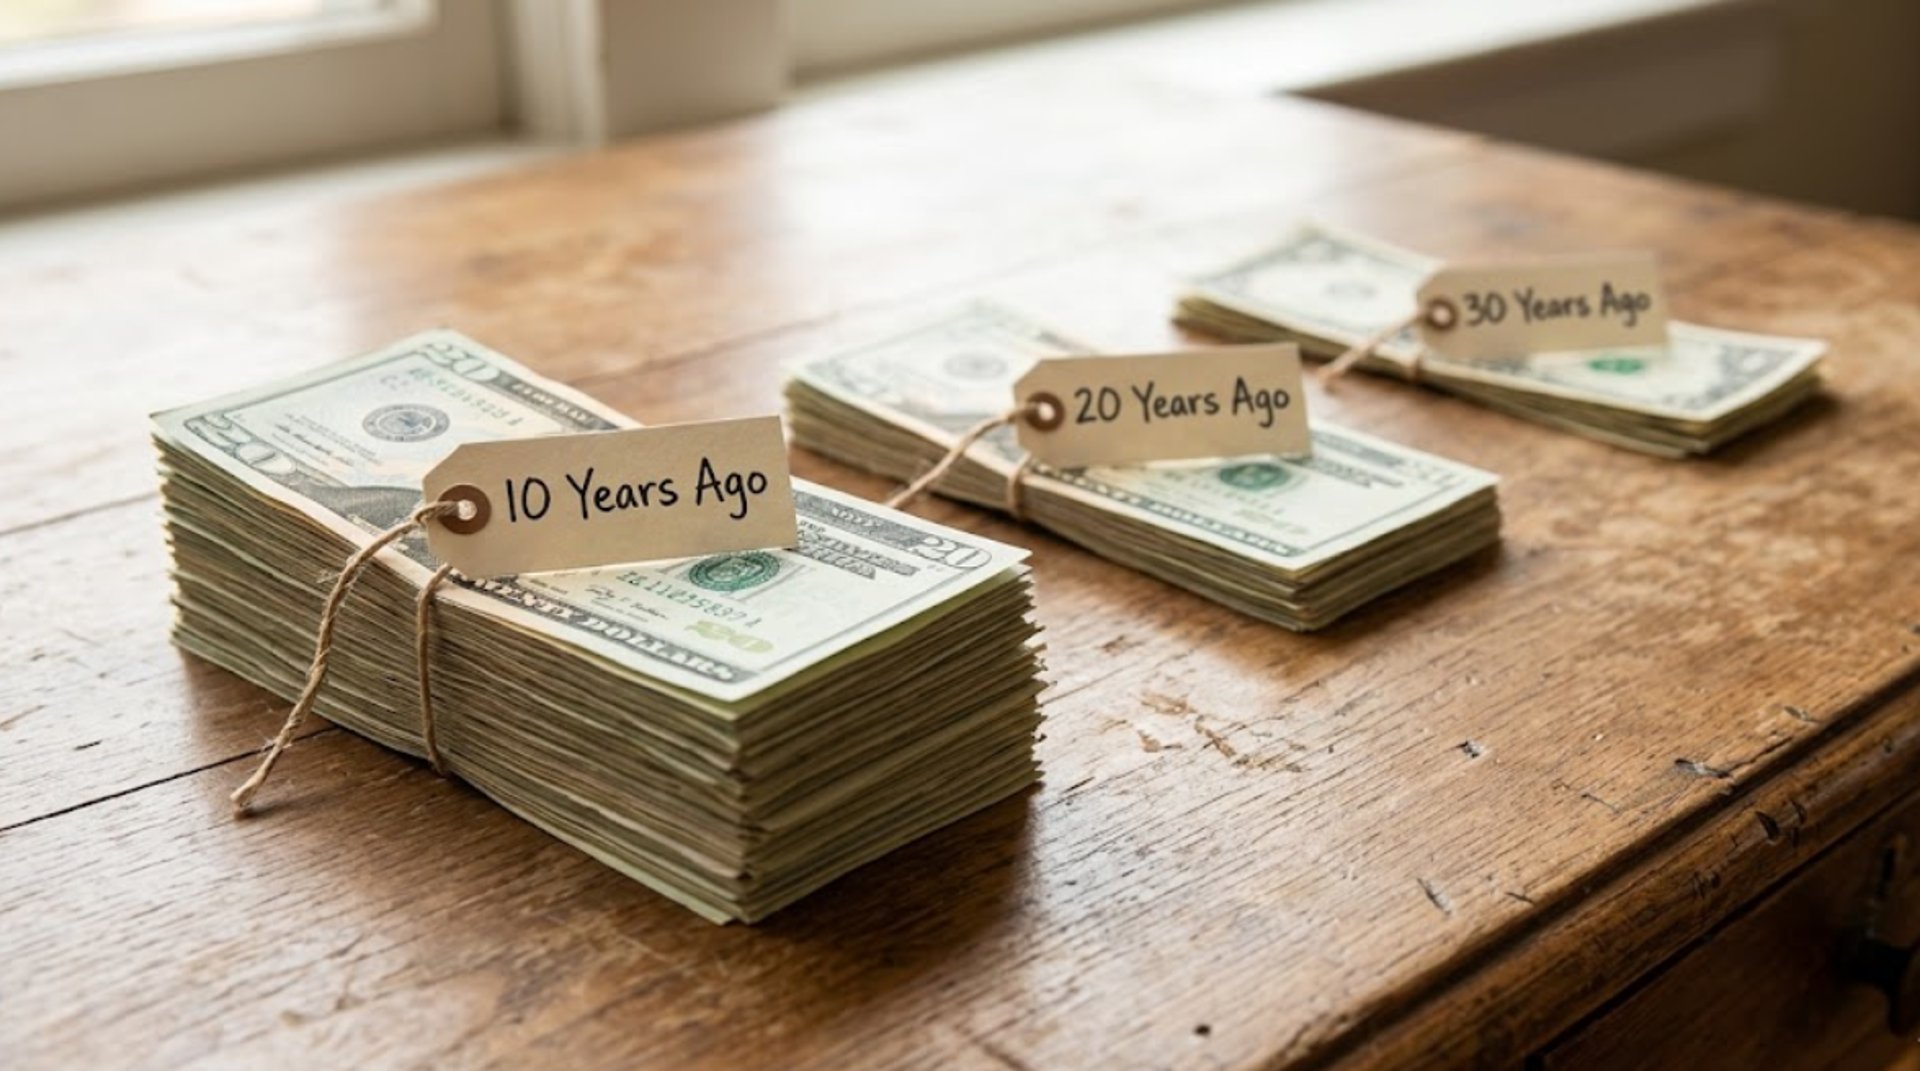
What $1,000 Was Worth 10, 20 and 30 Years Ago
See what $1,000 was really worth 10, 20 and 30 years ago after inflation. Real numbers, real examples, and what it means for your money right now in 2025.
Rachel
5/5/20267 min read
A $1,000 note looks exactly the same as it always has. Same size. Same colour. Same number printed on it.
But $1,000 today is not the same as $1,000 was ten years ago. Or twenty years ago. Or thirty.
The number stays fixed. The world around it changes. And the gap between what $1,000 could buy then versus what it can buy now is far wider than most people realise.
This post puts real numbers on that gap — and explains what it means for anyone trying to save, invest, or plan for the future today.
The Simple Truth About Money and Time
Money has a time value. A dollar today and a dollar in twenty years are not the same thing — not because the dollar changes, but because prices change around it.
When prices rise over time — which is what inflation does — each dollar quietly buys a little less. You do not notice it in any single day or even in any single year. But zoom out over a decade or two, and the cumulative effect is dramatic.
This is not a theory or an economic abstraction. It shows up in what you pay at the supermarket, what rent costs, what a car costs, what a doctor's visit costs. It is real and it is constant.
What $1,000 Was Worth — The Numbers
The following figures use US CPI data. Australian figures follow a very similar pattern — cumulative inflation in Australia over the same periods has been comparable, with some variation by era.
$1,000 in 2015 (10 Years Ago)
Cumulative US inflation from 2015 to 2025: approximately 33%
What this means in reverse: $1,000 today only has the purchasing power of about $752 in 2015 dollars.
If you had $1,000 sitting in a zero-interest account since 2015, you have quietly lost the purchasing power equivalent of $248 — without spending a single cent.
What $1,000 bought in 2015 that costs more today:
A week of groceries for a family of four: around $150–180 then, now closer to $220–260
A return domestic flight: roughly $300–350 then, now often $420–500
A basic smartphone: around $200–400, now $350–600 for equivalent specs
Monthly rent for a one-bedroom apartment in a mid-size city: $900–1,100 then, now $1,300–1,700 or more in many markets
$1,000 in 2005 (20 Years Ago)
Cumulative US inflation from 2005 to 2025: approximately 72%
What this means in reverse: $1,000 today only has the purchasing power of about $581 in 2005 dollars.
Nearly half the real value of $1,000 has been eroded over twenty years.
What $1,000 bought in 2005 that costs more today:
Average new car price: around $28,000 in 2005, now over $48,000
University tuition per year (US public university): around $5,500 then, now over $11,000
Average house price in the US: around $220,000 in 2005, now over $420,000
A Big Mac: around $3.06 in 2005, now around $5.50–6.00
$1,000 in 1995 (30 Years Ago)
Cumulative US inflation from 1995 to 2025: approximately 122%
What this means in reverse: $1,000 today only has the purchasing power of about $450 in 1995 dollars.
More than half the real value of $1,000 has disappeared over thirty years.
What $1,000 bought in 1995 that costs more today:
A gallon of petrol in the US: $1.15 in 1995, now around $3.30–3.80
Average monthly rent for a two-bedroom apartment: around $550 in 1995, now $1,700+ nationally
A brand new Toyota Camry: around $17,000 in 1995, now $29,000+
A hospital stay per day (US): around $900 in 1995, now over $2,800
The Australian Picture
Australia's inflation story is similar in shape, though the specific percentages vary by decade.
So $1,000 in Australian dollars in 1995 would need to be around $2,150 today just to have the same purchasing power. Anyone whose superannuation, savings, or income has not at least doubled in that period in nominal terms has effectively gone backwards in real wealth.
What This Means For Different Groups of People
If You Are a Saver
Savings accounts in the 1990s and early 2000s often paid 5–8% interest — enough to genuinely beat inflation. In the 2010s, rates collapsed to near zero in many countries, meaning savers were effectively guaranteed to lose real value year after year.
If you kept $10,000 in a low-yield savings account for the past twenty years, you likely ended up with nominally more money in the account — but significantly less purchasing power in real terms.
The lesson: cash savings are not storage. They are a slow drain if the rate you earn is below the inflation rate. Money that is not at minimum keeping pace with inflation is shrinking in real terms, every day.
If You Are Approaching Retirement
The thirty-year figure is particularly important for anyone thinking about retirement income.
If you retire at 65 with a fixed income of $50,000 per year — pension, annuity, or drawdown from savings — and you live to 95, you need that income to last thirty years. At historical average inflation, the purchasing power of $50,000 per year will have declined to the equivalent of around $22,500 in today's dollars by the time you reach 95.
That is not a comfortable retirement. That is a crisis that arrives slowly, year by year, until it becomes undeniable.
This is why retirement planning that does not account for inflation is fundamentally incomplete. The number that feels comfortable today will not feel comfortable in twenty years if it has not grown with the cost of living.
Use our Inflation Impact Calculator to run your own retirement income scenario and see exactly what your fixed income will be worth over time.
If You Are a Young Saver or First Home Buyer
The twenty and thirty year numbers have a more optimistic reading for young people — one that is worth understanding.
If inflation can cut the value of $1,000 in half over twenty years, it can also cut the real value of debt in half over the same period. A mortgage taken out today for $500,000 at a fixed rate will effectively cost less in real terms each year as inflation rises — the repayments stay the same but the money you use to make them is worth slightly less each year.
This is one reason why long-term property ownership, despite the high upfront cost, has historically been such an effective wealth builder. You lock in a debt at today's prices and repay it with tomorrow's increasingly cheaper dollars.
If You Are An Investor
The compound effect of inflation on investment returns is also important to understand in both directions.
A 7% average annual return sounds good. But if inflation is running at 3.5%, your real return is only about 3.5%. That is still positive — but it is less than half the nominal figure suggests.
This is why comparing investment returns to inflation, not to zero, is the correct benchmark. The question to ask is not "did my money grow?" but "did my money grow faster than inflation?" If the answer is no, you have worked hard for a real loss.
The Most Important Table on This Page
Here is what $1,000 becomes in real purchasing power over time at different inflation rates — assuming the $1,000 sits in cash earning nothing:
At 3.5% inflation — roughly the long-run average — $1,000 sitting in cash loses nearly two-thirds of its purchasing power over thirty years. At 5% inflation it loses almost three-quarters.
These are not edge cases. These are the normal, expected outcomes of doing nothing with money over a long period of time.
What You Can Do About It Right Now
Understanding this data is only useful if it changes how you act. Here are three immediate steps:
1. Check what your money is currently earning Log into every savings account and term deposit you hold. Write down the interest rate. Compare it to the current inflation rate in your country. If you are earning less than inflation, you are losing real value. Move your money to a better rate.
2. Run your own numbers Use our Inflation Impact Calculator to enter any amount — your savings, your super balance, your monthly income — and see what it will be worth in real terms in ten, twenty, or thirty years. The chart makes the abstract numbers very concrete, very fast.
3. Start or increase your investment habit Even a small regular investment in a broad index fund will, over time, dramatically outperform cash sitting in a savings account. The earlier you start the more powerful the compounding effect. The right time to start was twenty years ago. The second best time is today.
Frequently Asked Questions
Q: Are these figures accurate for Australia? The specific dollar amounts above use US CPI data but the pattern is very similar for Australia. Australian cumulative inflation figures are noted separately in the post. You can check exact Australian figures on the ABS website.
Q: What if I had invested that $1,000 instead of keeping it in cash? $1,000 invested in a broad US share market index fund in 1995 would be worth approximately $18,000–$22,000 today in nominal terms — and significantly more in real terms than the original $1,000 even after adjusting for inflation. The difference between investing and holding cash over thirty years is not incremental — it is transformational.
Q: Does this mean I should never hold cash? No. Cash serves an important role — emergency fund, short-term goals, stability. The point is that cash should not be where money sits that you do not need in the near term. Long-term money deserves long-term treatment.
Q: What was the highest inflation ever in Australia or the US? In Australia, inflation peaked at around 17% in 1951 and again briefly in the early 1970s. In the US, the peak in modern history was around 14.8% in 1980. The recent spike to 9.1% in the US in 2022 was the highest since then — significant but far from the historical extremes.
Q: What will $1,000 be worth in 2035? At 3.5% average inflation, $1,000 today will have the purchasing power of approximately $709 in 2035. Use our Inflation Impact Calculator to model any amount and any inflation rate for your own planning.
See It For Your Own Money
The $1,000 figure in this post is illustrative. But the principle applies to every dollar you have — your savings, your super, your salary, your pension.
Use our free Inflation Impact Calculator to enter your own numbers and see exactly what inflation is doing to your specific financial situation — not as a historical curiosity, but as a practical planning tool.
👉 Try the Inflation Impact Calculator
And if this post made you think about your salary, check whether it has kept pace with inflation over the same period with our Pay Rise Calculator.
👉 Use the Pay Rise Calculator
Know someone who still thinks keeping cash in a savings account is the safe option? Share this post with them. The numbers tend to change minds.
Relatable Useful Links:
ClearEveryday
Free Loan & Debt Repayment Calculator
Estimate monthly payments, interest costs, and payoff timelines in seconds.
Link
© ClearEveryday 2026. All rights reserved.
About
For informational purposes only — not financial advice